.png)
Business Intelligence &
Data Visualization
Intellicore Global helps organizations turn fragmented business information into structured, understandable, and decision-ready insights. From executive dashboards and KPI frameworks to BI platform implementation and enterprise reporting, we enable leadership to act with greater clarity and confidence.
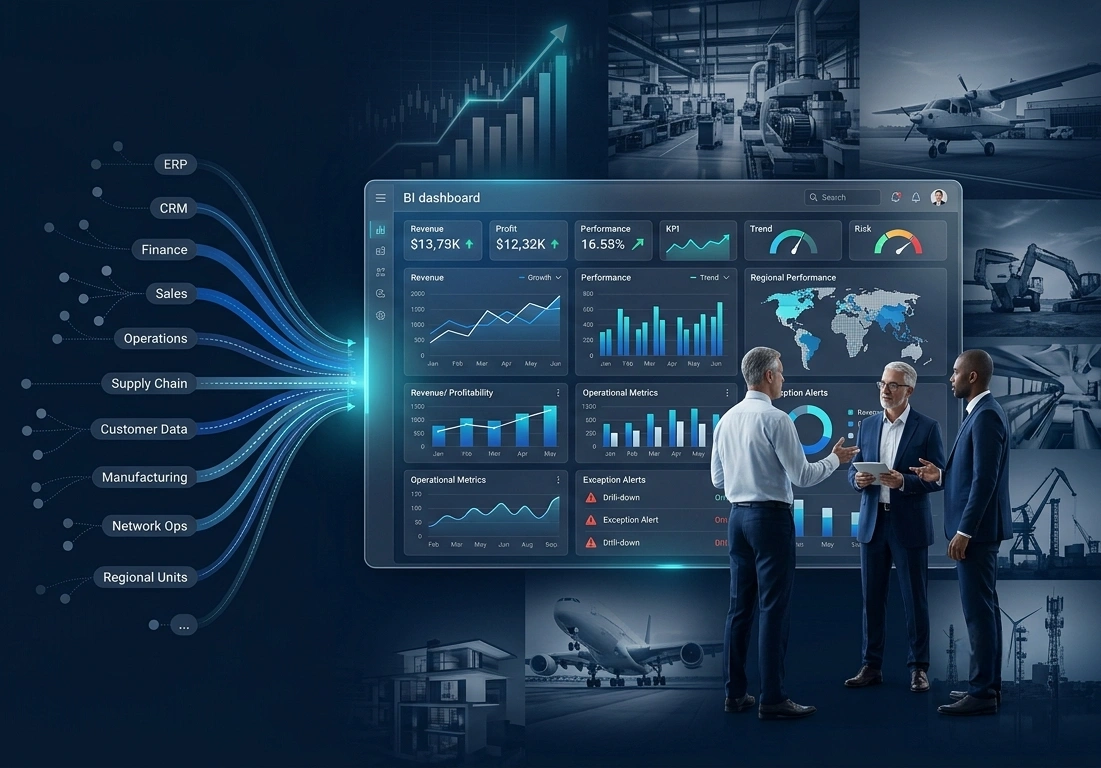
Turning Enterprise Data Into Clarity, Confidence and Action
Business leaders rarely have a shortage of data. The bigger challenge is knowing which numbers matter, whether those numbers can be trusted, and what they mean for the business. At Intellicore Global Consulting LLP, we help organizations turn fragmented business information into structured, understandable, and decision-ready insights.
We look beyond dashboards and reporting tools. Our focus is on helping leadership teams establish meaningful KPIs, consistent business definitions, reliable reporting, and visual insights that support real decisions. The objective is simple: give the right people the right information at the right level of detail so they can act with greater clarity and confidence.
Strong Business Intelligence gives leadership a reliable view of what is happening, why it is happening, and where attention may be required next.
Our Business Intelligence Philosophy
We see Business Intelligence as a decision-enablement discipline, not simply a reporting or dashboard exercise. A successful BI environment should make business performance easier to understand and decisions easier to make.
Business Objectives First, Dashboards Second
BI designed around decisions, not just data—ensuring every dashboard supports a business outcome
Consistent Definitions for Enterprise KPIs
Clear, standardized metrics that mean the same thing across teams, functions, and regions
Trusted Data and Clear Ownership
Data governance that builds confidence in the numbers used for critical business decisions
Visualizations Designed Around Decisions
Reports and dashboards structured to answer the questions leaders actually ask
Executive Clarity Without Losing Operational Detail
Information that works for both the boardroom and the teams that run the business
We believe Business Intelligence succeeds when leaders trust the information in front of them and can use it to make decisions without unnecessary delay. Our approach is designed to build that trust.
Our BI & Data Visualization Capabilities
Our services cover the business, analytical, and visualization requirements needed to establish useful and sustainable enterprise BI capabilities—from executive dashboards to KPI frameworks, BI platform implementation, governance, and analytics.
Executive Dashboards & Management Reporting
Concise views of business performance for senior leadership—reducing dependence on spreadsheets and disconnected reports.
- CEO, board, and executive dashboards
- Business performance scorecards
- Financial and operational KPI reporting
- Regional and business-unit performance views
- Exception and variance visibility
Outcome: Leadership quickly understands where the business stands and where management attention is required.
KPI Design & Performance Management
Defining and organizing measures that reflect actual business priorities—ensuring KPIs are meaningful, consistent, and actionable.
- Identification of business-critical KPIs
- KPI definitions and calculation logic
- Targets, thresholds, and performance indicators
- Functional and enterprise-level scorecards
- Consistent KPI interpretation across teams
Outcome: Clear KPI ownership that moves organizations from reporting numbers to managing performance.
Data Visualization & Interactive Dashboards
Visual reporting experiences that make important trends, relationships, exceptions, and performance changes easier to see and understand.
- Interactive management dashboards
- Operational and functional dashboards
- Drill-down and detail analysis
- Trend and variance visualization
- Visual storytelling around business questions
Outcome: Reduced effort to understand information without oversimplifying the underlying business context.
BI Platform Implementation & Enablement
Establishing and improving BI environments using leading analytics and visualization platforms—balancing self-service analytics with enterprise governance.
- Microsoft Power BI implementation and enablement
- Tableau and Qlik BI environments
- Dashboard and reporting architecture
- Semantic model and data model considerations
- Role-based access and governance
- Performance and adoption considerations
Outcome: Governed BI platforms that support both self-service analytics and enterprise reporting requirements.
Enterprise Reporting & Data Consolidation
Bringing reporting requirements from across spreadsheets, applications, departments, and regions into a more consistent structure.
- Consolidation of management reporting
- Cross-functional reporting frameworks
- Harmonization of business metrics
- Reporting across multiple business units and geographies
- Reduction of duplicate and conflicting reports
Outcome: A more consistent information environment for management and operational teams.
BI Governance & Data Quality
Trust is fundamental to Business Intelligence. If different teams use different definitions or question the underlying numbers, even a well-built dashboard loses its value.
- Data and KPI ownership
- Business definitions and metric standards
- Data quality considerations
- Reporting governance and access controls
- Structured management of enterprise BI assets
Outcome: Confidence in the information used for important business decisions.
Business Analytics & Decision Support
Understanding more than what happened—helping management investigate why performance changed and where action may be needed.
- Trend and historical performance analysis
- Variance and root-cause analysis
- Customer and operational performance analysis
- Financial and profitability analysis
- Management decision-support reporting
Outcome: Business data transformed into information that management teams can use during planning, review, and decision-making.
Self-Service BI With Enterprise Control
Giving business teams greater analytical independence while maintaining the control, consistency, and security required in an enterprise environment.
- Business-user reporting enablement
- Governed self-service analytics
- Reusable data and reporting models
- Access and security considerations
- BI adoption and user enablement
Outcome: Greater analytical independence for business users without creating another layer of uncontrolled reporting.
Industry-Wise Business Intelligence Expertise
Business Intelligence becomes valuable when it reflects the way an industry actually operates. We help organizations build reporting and analytical views around the metrics, decisions, and operational realities that matter to their business.
Banking, Financial Services & Insurance
- Executive performance and profitability dashboards
- Customer, product, and portfolio analytics
- Branch, channel, and operational performance reporting
- Risk, compliance, and management reporting
- Financial and management KPI visualization
- Trend, variance, and exception analysis
Business focus: Giving financial leadership a clearer view of performance, risk, profitability, and customer trends.
Manufacturing
- Production performance dashboards
- Plant and machine performance analysis
- Quality and production variance reporting
- Inventory and supply chain visibility
- Procurement and supplier performance analytics
- Cost, productivity, and operational KPI monitoring
Business focus: Helping management identify operational bottlenecks, productivity gaps, cost drivers, and opportunities for improvement.
Aviation
- Operational performance dashboards
- Flight, turnaround, and service analytics
- Maintenance and asset performance reporting
- Cost and resource utilization analysis
- Customer and service performance visualization
- Executive reporting for operational decision-making
Business focus: Improving visibility into operational performance, resource utilization, service levels, and business efficiency.
Heavy Mining Equipment & Machinery
- Equipment utilization dashboards
- Service and maintenance analytics
- Spare parts and inventory visibility
- Sales, dealer, and customer performance reporting
- Cost and profitability analysis
- Asset lifecycle performance reporting
Business focus: Providing management with visibility into asset performance, service operations, profitability, and equipment utilization.
Oil & Gas
- Production and operational dashboards
- Asset and equipment performance analysis
- Cost and project performance reporting
- Procurement and supply chain analytics
- Safety and operational KPI monitoring
- Executive reporting across business units
Business focus: Bringing operational, financial, and asset information together to support complex business decisions.
Real Estate & Infrastructure
- Project performance dashboards
- Sales pipeline and revenue analytics
- Property inventory and occupancy reporting
- Customer and channel performance analysis
- Project cost and profitability reporting
- Management dashboards for portfolio visibility
Business focus: Helping leadership understand project, portfolio, sales, and financial performance from a single view.
Telecommunications
- Network and service performance dashboards
- Customer and subscriber analytics
- Revenue and product performance reporting
- Operational KPI monitoring
- Churn and customer behavior analysis
- Executive dashboards across regions and business units
Business focus: Helping management connect customer, operational, and financial data to improve business visibility.
Large & Diversified Enterprises
- Enterprise-wide management dashboards
- Cross-business-unit performance reporting
- Corporate KPI and scorecard management
- Consolidated financial and operational reporting
- Regional and multi-location analytics
- Leadership reporting across functions
Business focus: Creating a consistent view of enterprise performance while preserving the detail needed by individual functions and business units.
Trusted by Enterprise Leaders Worldwide
Our Business Intelligence services are designed for organizations where leadership needs reliable visibility across multiple functions, locations, products, or business units. We work with senior leadership, data teams, and operational teams to build BI capabilities that support better decisions.
Executive & Board Leadership
CEOs & Managing Directors
Strategic Vision
Executive LeadershipCFOs & Finance Leadership
Financial Performance
FinanceBusiness Unit Leaders
Operational Performance
OperationsTechnology & Analytics Leadership
CIOs & CTOs
Technology Strategy
IT LeadershipData & Analytics Leaders
Data Strategy
Data LeadershipBI & Reporting Teams
BI Enablement
BIDigital Transformation
Innovation · Change
TransformationWe understand that the information required by a boardroom is different from the information required by an operations team. Effective BI connects both—providing clarity, confidence, and action at every level.
Why Enterprises Choose Intellicore for BI
Enterprise-First Approach to BI
Strong Understanding of Business & Technology Requirements
Focus on Executive Clarity and Practical Business Outcomes
Structured Approach to KPIs, Reporting, and Governance
Experience Supporting Complex and Multi-Function Organizations
Focus on Trusted Information Rather Than Dashboard Volume
We believe Business Intelligence succeeds when leaders trust the information in front of them and can use it to make decisions without unnecessary delay. Our approach is designed to build that trust.
Turn Business Data Into Better Decisions
Intellicore Global Consulting LLP helps enterprises build Business Intelligence environments that make performance, trends, risks, and opportunities easier to understand. From executive dashboards and KPI frameworks to enterprise reporting, data visualization, BI governance, and analytics, our services are designed around the decisions your organization needs to make.
Make business performance easier to see. Make important decisions easier to support.
Whether you are replacing spreadsheet-driven reporting, consolidating information across business units, establishing executive dashboards, or strengthening an existing BI environment, Intellicore can help you create a more structured and useful approach to Business Intelligence.
FAQs
Frequently Asked Questions
Learn how enterprise Business Intelligence can improve reporting, executive visibility, KPI management, data visualization, and decision-making.
Business Intelligence is the structured use of business data, reporting, analytics, and visualization to help organizations understand performance and make informed decisions. In an enterprise environment, BI can bring information from different functions and systems together into consistent views for leadership and operational teams.
Our BI services focus on turning data into clarity, confidence, and action.
Business Intelligence can give owners, directors, and senior executives a clearer view of revenue, profitability, operational performance, customer trends, costs, and business-unit performance.
It can reduce dependence on manually prepared reports and make important changes in business performance easier to identify—enabling faster, more confident decision-making.
Depending on the organization's requirements, dashboards can cover executive performance, financial results, sales, customers, operations, production, supply chain, service performance, project performance, and other management KPIs.
The dashboard structure should reflect the decisions the intended users need to make. Our approach is decision-driven, not data-driven.
KPI definitions are important because different departments can otherwise calculate or interpret the same metric differently. A structured KPI framework establishes what a measure means, how it is calculated, who owns it, and how it should be interpreted.
This helps leadership work from a more consistent view of performance and make decisions based on trusted information.
Yes. Enterprise BI can bring together information from multiple systems, departments, locations, and business units. The exact approach depends on the organization's data environment, reporting requirements, and governance model.
The objective is to create consistent management information while retaining the appropriate level of operational detail.
Intellicore approaches Business Intelligence from a business and decision-making perspective. We consider business objectives, KPIs, reporting requirements, data availability, governance, users, and technology together.
The aim is to create BI capabilities that are useful to leadership and practical for the teams responsible for managing and using the information.
Intellicore supports leading enterprise BI platforms including Microsoft Power BI, Tableau, and Qlik. Our approach focuses on platform implementation, enablement, dashboard architecture, semantic modeling, and governance—ensuring that BI environments support both self-service analytics and enterprise reporting requirements.
We balance platform capabilities with the governance required in an enterprise environment.
Self-service BI gives business teams greater analytical independence while maintaining the control, consistency, and security required in an enterprise environment.
We support self-service BI through business-user reporting enablement, governed self-service analytics, reusable data and reporting models, access and security considerations, and BI adoption and user enablement—ensuring that self-service doesn't create another layer of uncontrolled reporting.